The Dollar and Foreign Capital Flows
Do foreign purchases of US assets forecast the real dollar?
Published 2026-07-28. Sample 1973Q1 to 2025Q4 (212 quarters; 496 months at monthly frequency). Edward Long, Long Research.
Foreign capital flowing into US assets is one of the most frequently cited drivers of the dollar. This study tests that claim directly. Across 40 pre-registered specifications spanning fifty years, three distinct capital-flow channels, six macro and technical controls, two sampling frequencies, and two ways of expressing the target, not one specification forecast the real dollar well enough to beat a constant-mean baseline at the pre-registered significance threshold.
The strongest predictive correlation found anywhere in the study was foreign direct investment at r = +0.169. That is not a signal a portfolio can be built on. The result is reported as a null, because a null that was honestly tested is more useful than a finding that was not.
Does foreign buying of US assets lead the dollar?
The mechanism is intuitive. To buy a US Treasury, a foreign investor must first buy dollars. Sustained net purchases should therefore show up as currency demand. If that channel dominates, capital flows in one quarter ought to carry information about the dollar in the next.
Several forces work against it. Reserve managers routinely hedge their currency exposure, muting the spot impact. Causality may run the other way, with foreign appetite responding to the dollar rather than leading it. And rate differentials, growth differentials, and risk sentiment all move the currency independently. Whether the flow channel survives is an empirical question, which is why it was tested rather than asserted.
Three channels, fifty years
Foreign capital reaches the US through distinct routes, and each is measured separately: purchases of Treasury securities, portfolio purchases of corporate equities, and foreign direct investment. The dollar is the broad trade-weighted index deflated by CPI, so the variable is the real external price of the currency rather than a nominal index drifting with domestic inflation.
Consistent units, without exception
Every monetary series is deflated by the same CPI. Mixing inflation-adjusted and unadjusted variables in one regression manufactures relationships that are artifacts of inconsistent units rather than economics. This is not a theoretical concern here: an earlier version of this model paired a real dollar with a nominal flow and produced an apparently significant result at p = 0.025. Putting both on a constant-dollar basis moved the same test to p = 0.122. The signal was the units.
Interest rates are the deliberate exception. A percentage is not a monetary quantity, so deflating it would be meaningless; rate differentials enter in percentage points.
Transactions, not changes in holdings
Equity and direct-investment flows are taken from published transactions series rather than by differencing the corresponding holdings. For equities this is decisive. The value of foreign-held US equities moves mostly on price revaluation, which the Financial Accounts publish as a separate component; in recent quarters that revaluation has run larger than the transactions themselves. Differencing the holdings would have produced a variable that mostly tracks the stock market while being labelled foreign buying.
Disclosed coverage limits
Series that cannot span the window are reported as unavailable rather than used to silently shorten the sample. The euro-area growth gap begins in 1995 and is empty before then. VIX, the goods-and-services trade balance, and the Japanese ten-year yield were excluded on the same grounds. There is no monthly direct-investment series anywhere, because direct investment is compiled quarterly; the monthly frame therefore carries portfolio flows only and says so.
Reaching fifty years requires one disclosed methodology choice: TWEXMMTH chain-linked to DTWEXBGS by growth at 2019Q4. The join is growth-chained rather than level-spliced, and the anchor quarter is recorded in every artifact.
Registered before the data was touched
Every specification was written down with its null hypothesis and decision rule before being run. A specification is recorded as validated only if all three conditions hold on data the model has never seen: it beats the constant-mean baseline, the improvement is statistically significant, and overfitting stays within band.
| Split | Temporal 60 / 20 / 20, no look-ahead; the test set is evaluated once |
| Baseline | Constant mean of the training target, carrying no feature information |
| Cross-validation | Rolling-origin expanding window, which respects time order |
| Significance | Bootstrap resampling, making no distributional assumption |
| Overfitting | Logarithmic overfitting ratio and composite overfitting score |
| Estimator | Ordinary least squares with intercept, closed form |
Correcting for the search itself
Testing many specifications and reporting the best one at p < 0.05 is a false-positive machine. Across 40 specifications, roughly 2.0 would clear an unadjusted five percent threshold by chance alone. The threshold is therefore Bonferroni-adjusted to 0.00125, and the family size and adjusted threshold are recorded in every artifact. The adjustment was fixed before results were read, because choosing it afterwards defeats its purpose.
No channel carries usable information
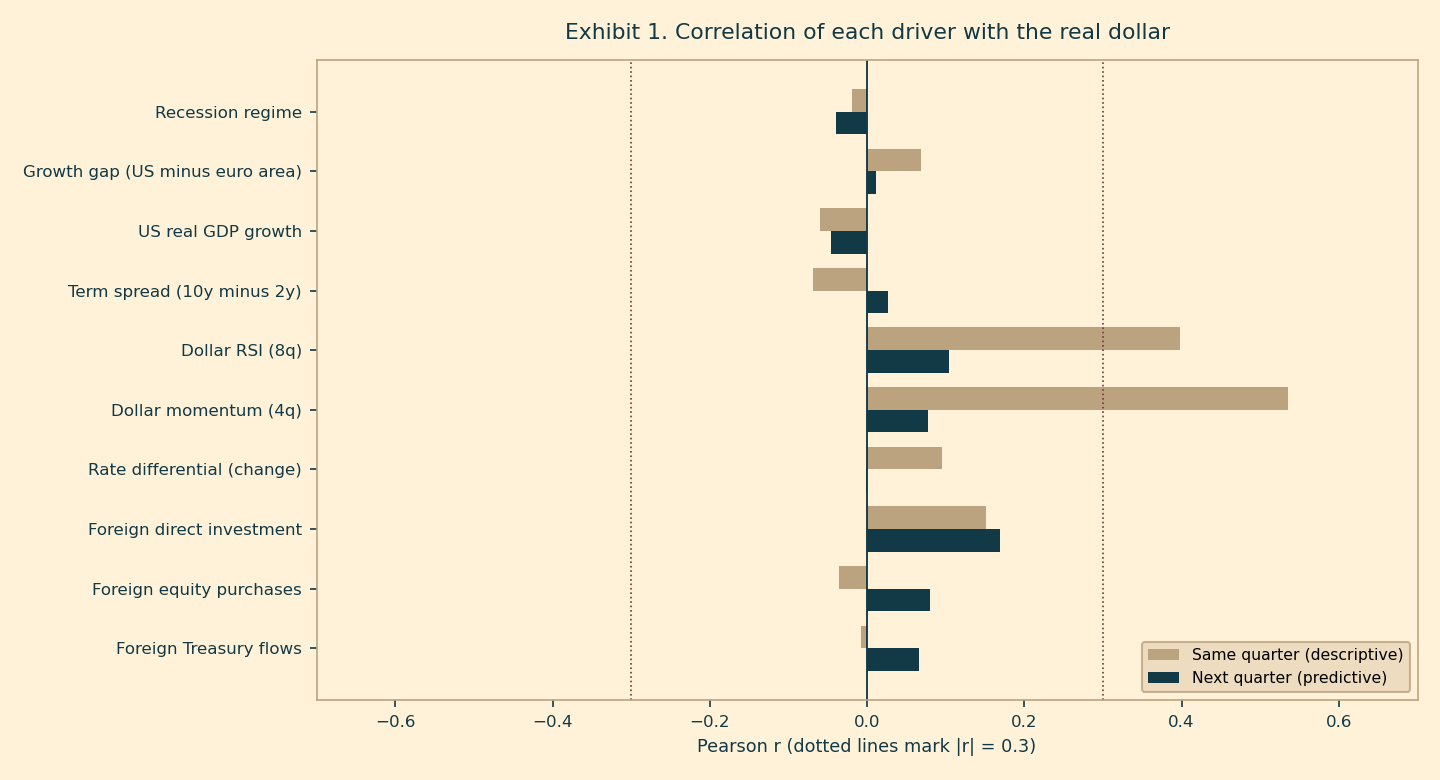
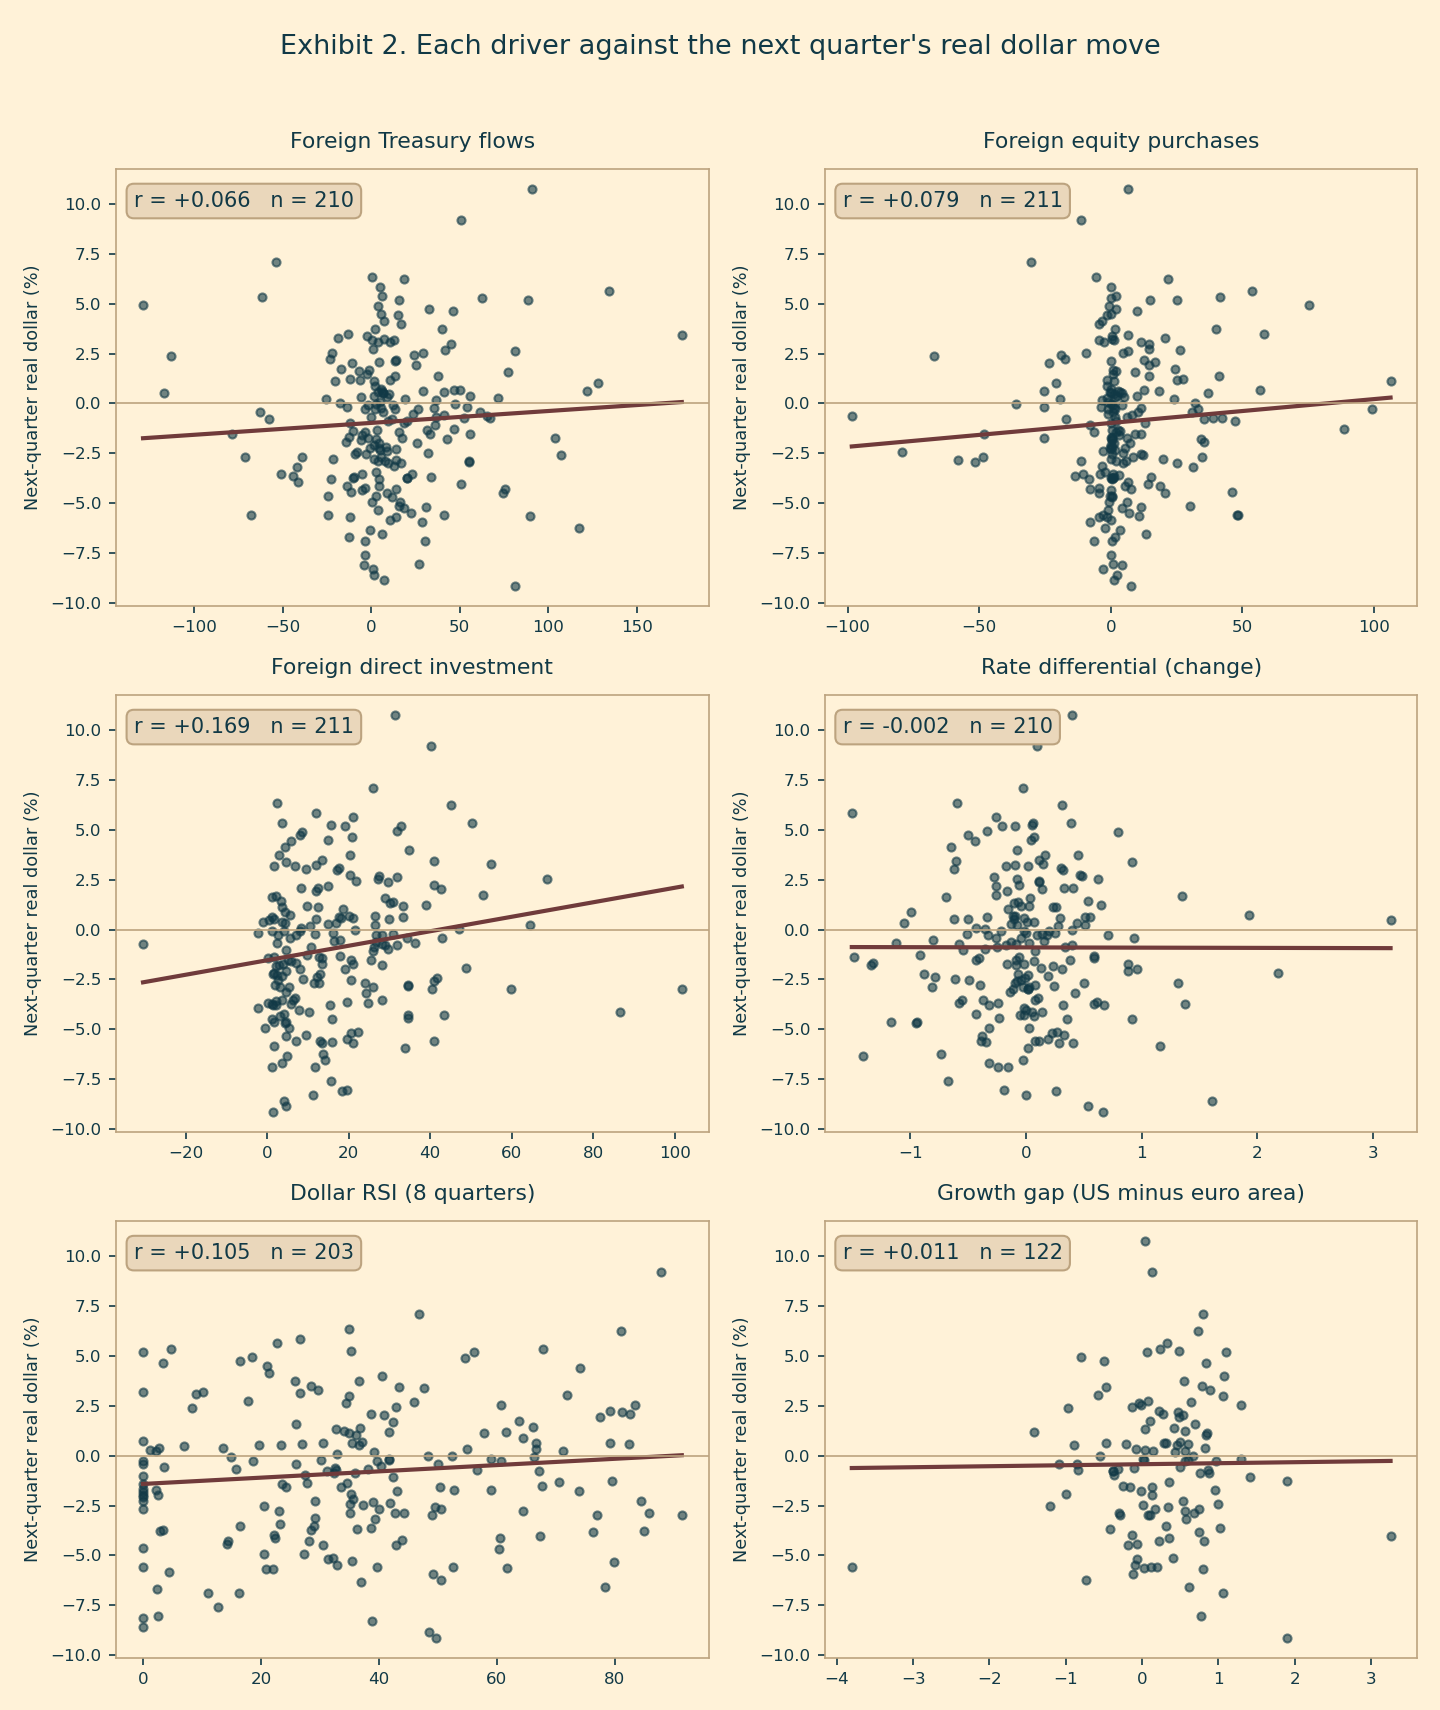
Every predictive correlation is small. The scatter plots show why no linear model recovers an edge: the clouds are round, not sloped.
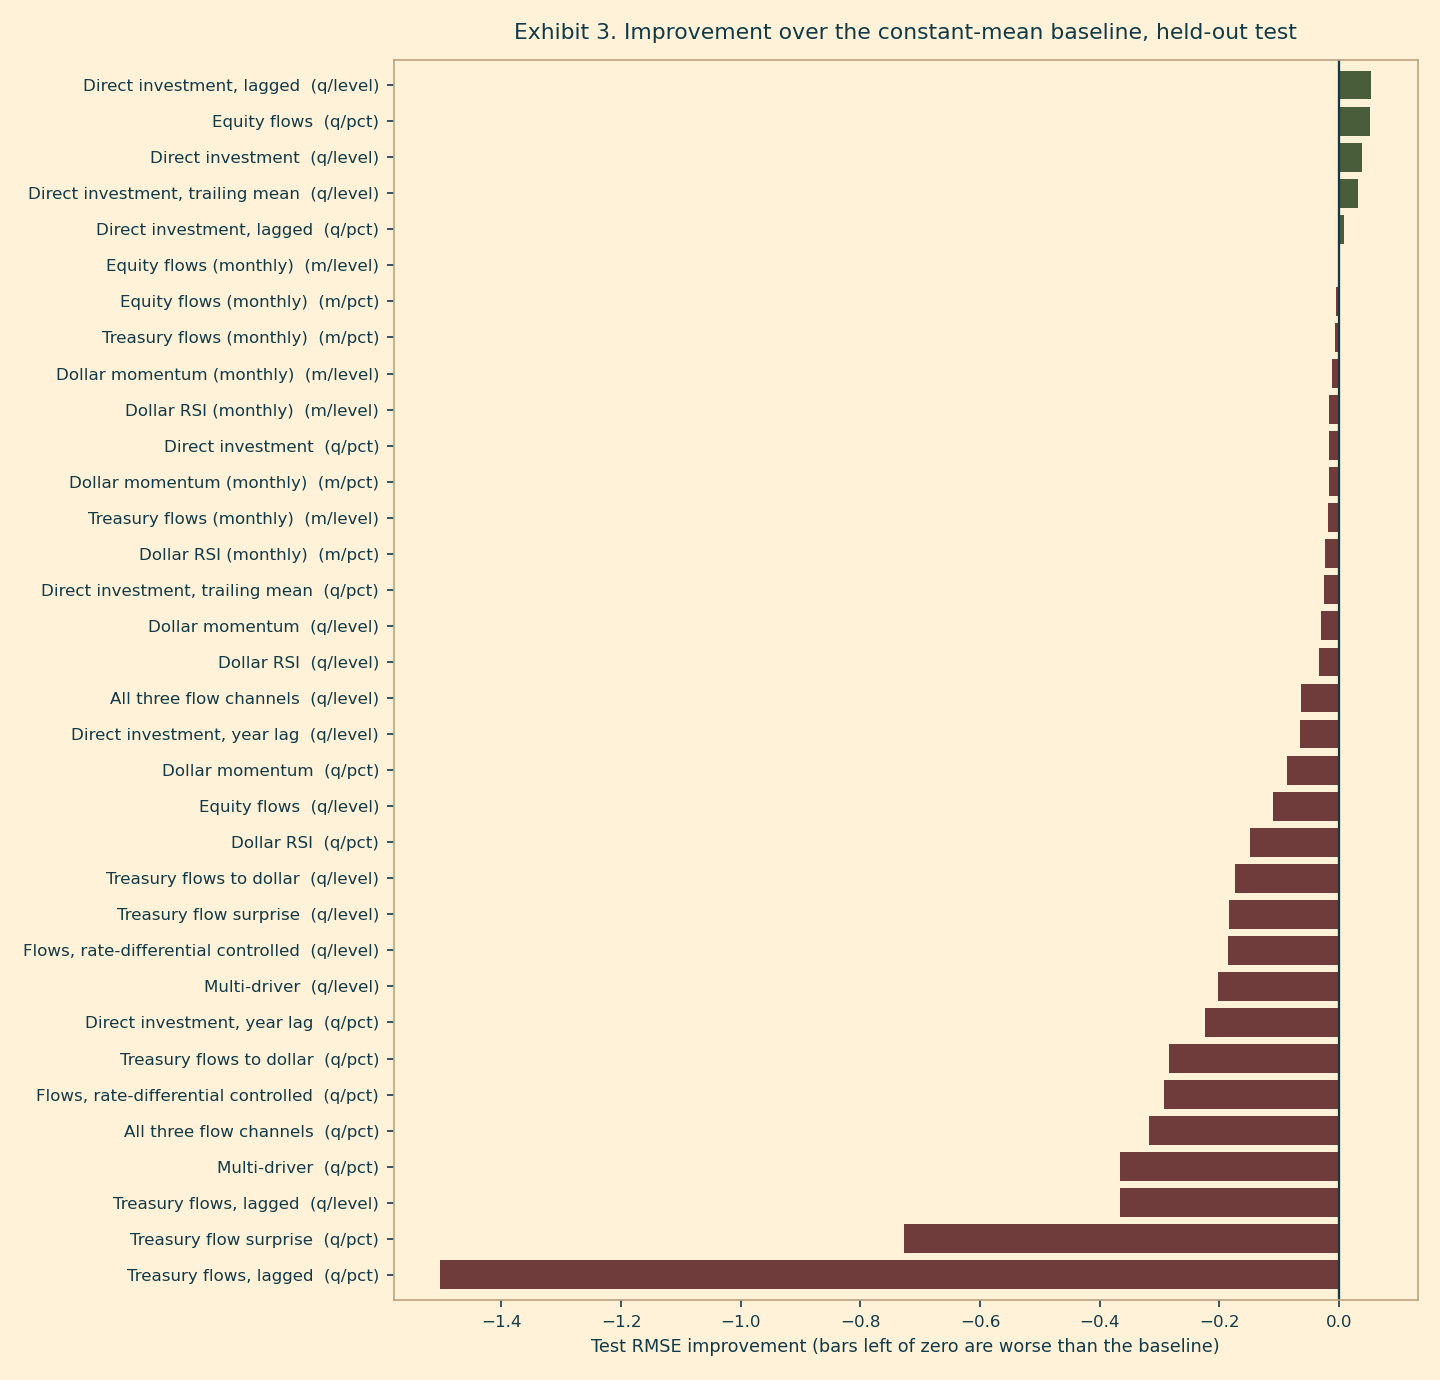
Out-of-sample performance is the decisive test, and it is worse than the correlations suggest. Most specifications do not merely fail to beat the constant-mean baseline; they lose to it. Adding features made this reliably worse, which is the expected signature of overfitting on a sample this size.
Direct investment, and the power test
One driver did stand out. Foreign direct investment produced the strongest predictive correlation in the study and beat the baseline on the held-out test, though at a p-value well short of significance. It was pursued deliberately: lagged one and two quarters, lagged a full year, and smoothed with a trailing four-quarter mean, since direct investment is lumpy and a single large acquisition lands in one quarter.
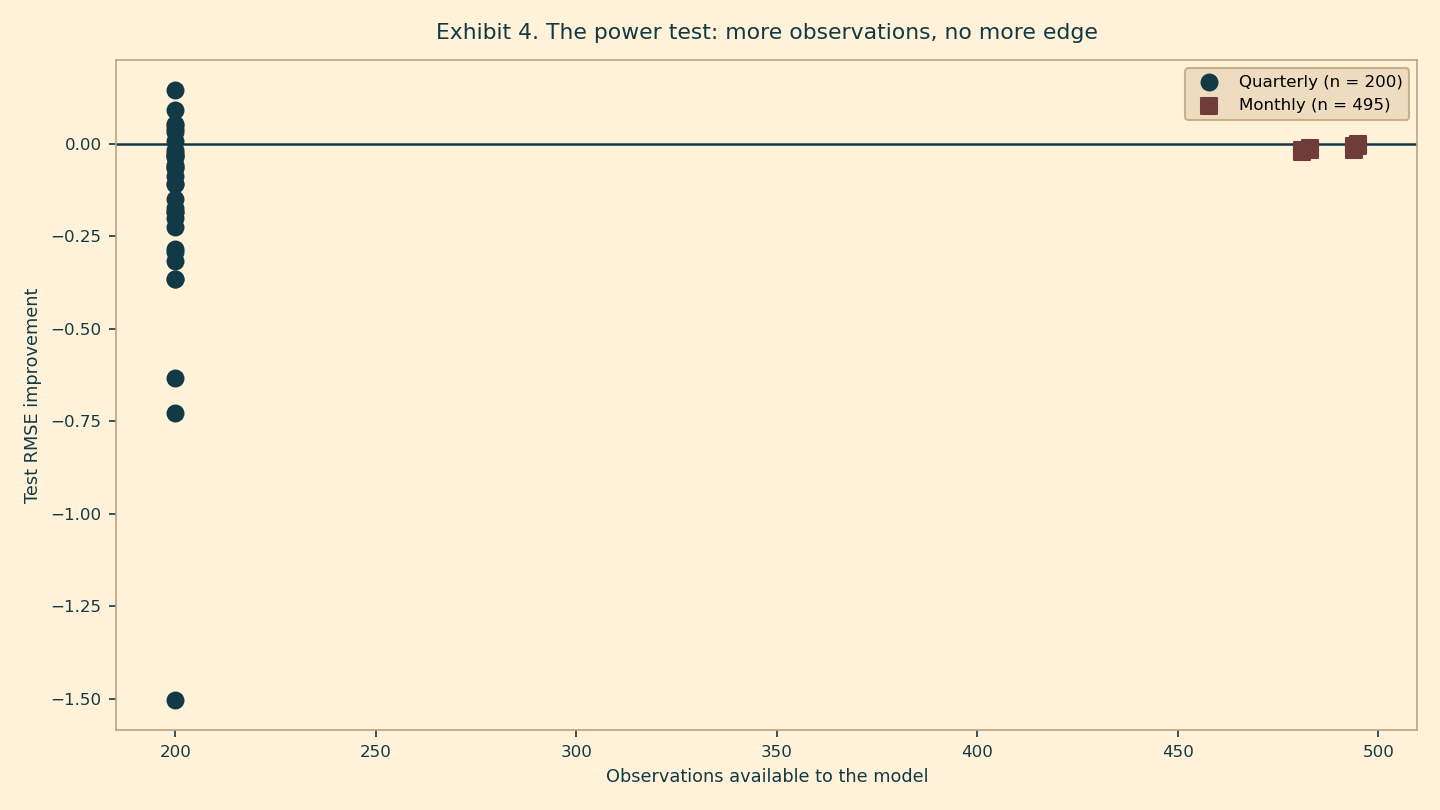
None of it held. The decisive evidence came from frequency. Moving to monthly sampling supplies roughly 496 observations against 212 quarterly, a genuine increase in statistical power. A real effect, even a small one, strengthens as power rises. This one weakened: every monthly specification landed at or below zero improvement. That pattern is the signature of noise, not of a small true effect, and the lead is recorded as closed rather than pending.
Every specification, including the failures
All 40 specifications are reported. Selective reporting is the mechanism by which nulls become findings, so nothing is omitted for being uninteresting.
Quarterly, 1973 to 2025
| Specification | Target | n | Delta | p | Outcome |
|---|---|---|---|---|---|
| Treasury flows to dollar | index pts | 200 | -0.1743 | 0.995 | not validated |
| Treasury flows, lagged | index pts | 200 | -0.3655 | 1.000 | not validated |
| Treasury flow surprise | index pts | 200 | -0.1839 | 0.999 | not validated |
| Flows, rate-differential controlled | index pts | 200 | -0.1861 | 0.997 | not validated |
| Dollar momentum | index pts | 200 | -0.0299 | 0.966 | not validated |
| Dollar RSI | index pts | 200 | -0.0341 | 0.867 | not validated |
| Equity flows | index pts | 200 | -0.1095 | 0.952 | not validated |
| Direct investment | index pts | 200 | +0.0391 | 0.171 | not validated |
| Direct investment, lagged | index pts | 200 | +0.0534 | 0.149 | not validated |
| Direct investment, year lag | index pts | 200 | -0.0651 | 0.777 | not validated |
| Direct investment, trailing mean | index pts | 200 | +0.0316 | 0.306 | not validated |
| All three flow channels | index pts | 200 | -0.0633 | 0.863 | not validated |
| Multi-driver | index pts | 200 | -0.2020 | 1.000 | not validated |
| Reverse: dollar to flows | index pts | 200 | +0.0914 | 0.122 | not validated |
| Reverse, lagged | index pts | 200 | -0.0578 | 0.595 | not validated |
| Reverse, regime-aware | index pts | 200 | +0.1441 | 0.318 | not validated |
| Treasury flows to dollar | percent | 200 | -0.2848 | 0.912 | not validated |
| Treasury flows, lagged | percent | 200 | -1.5023 | 1.000 | not validated |
| Treasury flow surprise | percent | 200 | -0.7280 | 0.996 | not validated |
| Flows, rate-differential controlled | percent | 200 | -0.2930 | 0.915 | not validated |
| Dollar momentum | percent | 200 | -0.0872 | 0.995 | not validated |
| Dollar RSI | percent | 200 | -0.1494 | 0.975 | not validated |
| Equity flows | percent | 200 | +0.0515 | 0.219 | not validated |
| Direct investment | percent | 200 | -0.0166 | 0.541 | not validated |
| Direct investment, lagged | percent | 200 | +0.0083 | 0.473 | not validated |
| Direct investment, year lag | percent | 200 | -0.2247 | 0.908 | not validated |
| Direct investment, trailing mean | percent | 200 | -0.0254 | 0.566 | not validated |
| All three flow channels | percent | 200 | -0.3172 | 0.965 | not validated |
| Multi-driver | percent | 200 | -0.3653 | 0.957 | not validated |
| Reverse: dollar to flows | percent | 200 | -0.0364 | 0.985 | not validated |
| Reverse, lagged | percent | 200 | -0.1091 | 0.716 | not validated |
| Reverse, regime-aware | percent | 200 | -0.6326 | 0.862 | not validated |
Monthly, TIC portfolio flows, 1985 onward
| Specification | Target | n | Delta | p | Outcome |
|---|---|---|---|---|---|
| Equity flows (monthly) | index pts | 495 | -0.0002 | 0.548 | not validated |
| Treasury flows (monthly) | index pts | 494 | -0.0182 | 0.755 | not validated |
| Dollar momentum (monthly) | index pts | 483 | -0.0119 | 0.961 | not validated |
| Dollar RSI (monthly) | index pts | 481 | -0.0163 | 0.995 | not validated |
| Equity flows (monthly) | percent | 495 | -0.0052 | 0.604 | not validated |
| Treasury flows (monthly) | percent | 494 | -0.0064 | 0.598 | not validated |
| Dollar momentum (monthly) | percent | 483 | -0.0170 | 0.948 | not validated |
| Dollar RSI (monthly) | percent | 481 | -0.0237 | 0.982 | not validated |
7 of 40 specifications beat the baseline by some margin. The best of them reached p = 0.122, against a required threshold of 0.00125. None is reported as a finding.
What a null of this size means
This study does not show that capital flows are irrelevant to exchange rates. It shows something narrower and more defensible: that at quarterly and monthly horizons, over fifty years, a linear relationship between published capital-flow aggregates and the subsequent real dollar is not strong enough to beat predicting the average. That is consistent with a long-standing result in international finance, that exchange rates are difficult to forecast out of sample at short horizons using observable fundamentals.
Several readings remain open. The relationship may be non-linear, may operate at horizons shorter than a month or longer than a year, may hold only conditionally in particular regimes, or may be visible in disaggregated flows that published aggregates obscure. Each is a separate hypothesis requiring its own registration and its own test. None of them is evidenced by this study, and none should be inferred from it.
The practical implication is the one worth stating plainly: a published narrative that foreign buying drives the dollar should not be treated as a forecasting input without evidence that it survives an honest out-of-sample test. In this sample, it does not.
- Quarterly data is a small sample; treat any relationship as low-power.
- Foreign Treasury holdings (FDHBFIN) are a level; the flow is a first difference and is revised.
- Single-factor macro spec; ignores rate differentials, risk sentiment, and other drivers.
- Significance threshold Bonferroni-adjusted from 0.05 to 0.00125 because 40 specifications were searched over.
- Dollar index is a growth-chained splice at the anchor quarter; treat the join with care.
- Foreign flow is measured in constant (CPI-deflated) dollars.
- Dollar change is an index-point difference; it is not scale-free across the sample.
- Dollar index is spliced: TWEXMMTH chain-linked to DTWEXBGS by growth at 2019Q4
Known failure modes
- Regime shifts (crises, policy changes) can break the historical relationship.
- A near-singular design (little feature variation) is rejected by factor.ols_exposures.v1 rather than fit.
| FRED TWEXMMTH (US Dollar Index); TWEXMMTH chain-linked to DTWEXBGS by growth at 2019Q4 |
| FRED CPIAUCSL (CPI; deflates the dollar index and, by default, foreign holdings to constant dollars) |
| FRED FDHBFIN (foreign-held Treasuries) |
| FRED JHDUSRGDPBR (GDP-based recession indicator; regime spec only) |
| FRED DGS10, IRLTLT01DEM156N, IRLTLT01GBM156N (US-versus-peer long-rate differential; control specs only) |
| FRED BOGZ1FU263064105Q (Z.1 foreign net purchases of US corporate equities, transactions) |
| FRED BOGZ1FU263092001Q (Z.1 foreign direct investment into the US, transactions) |
| FRED TWEXMMTH (US Dollar Index, monthly); TWEXMMTH chain-linked to DTWEXBGS by growth at 2019-12 |
| FRED CPIAUCSL (CPI; deflates the dollar index and the flows) |
| FRED FORLTEQTYNET99996 (TIC monthly foreign net transactions in US equities) |
| FRED FORLTTREASNET99996 (TIC monthly foreign net transactions in long-term Treasuries) |
Estimation and correlation use registered, gate-tested equations from the Long Research valuation layer: factor.ols_exposures.v1, factor.expected_return.v1, covariance.pearson_correlation.v1. No model mathematics was written for this study; the pipeline supplies the experimental discipline around equations that already exist and are independently validated.